
How to Hack Hubstaff with Lumous: October 2026 Test
We ran Lumous with Hubstaff tracking in the background for over nine hours, then signed in as an admin to see what had been recorded. We checked the applications, websites, screenshots, mouse and keyboard activity, and unusual activity reports.
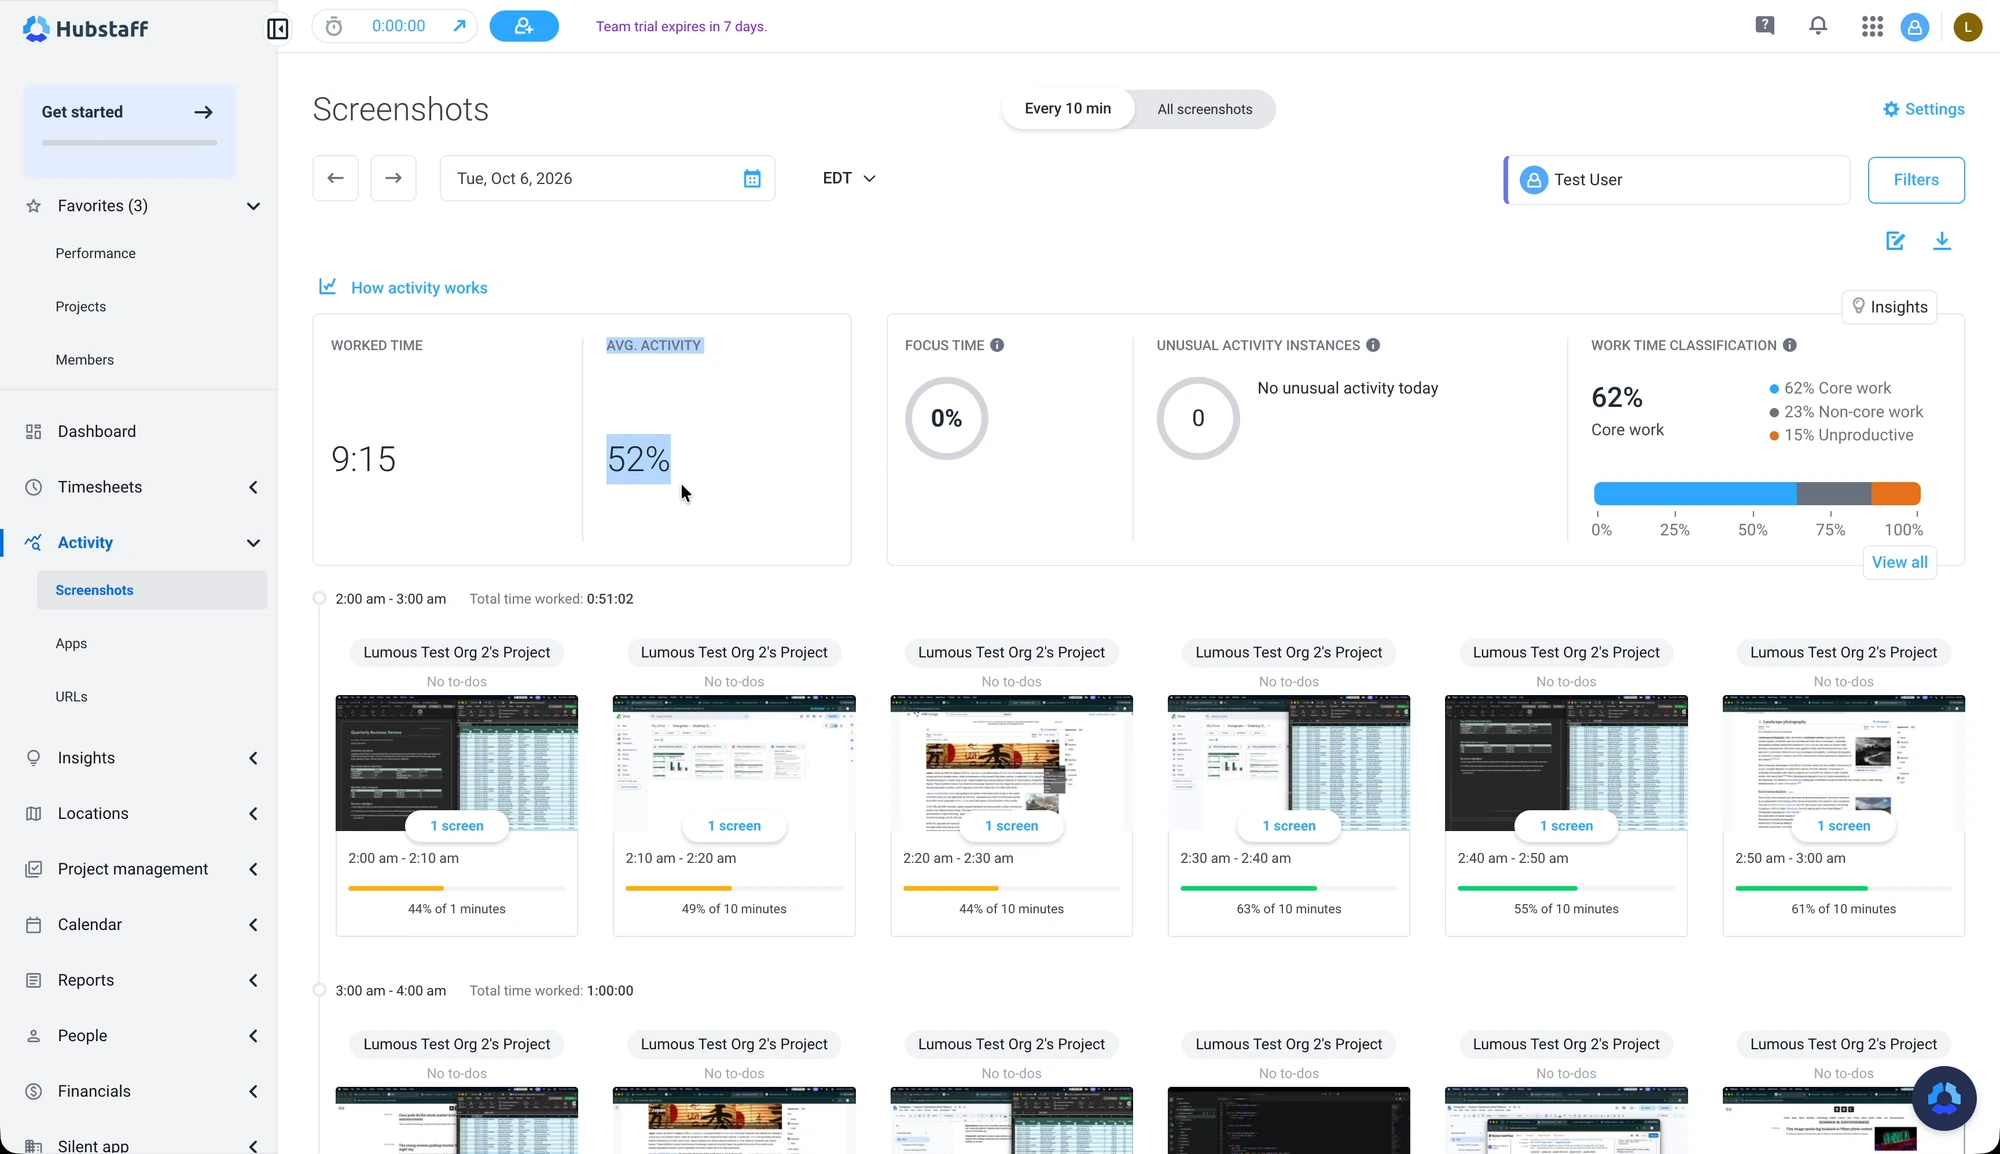
Hubstaff recorded 9 hours and 15 minutes of worked time, 52% average activity, and zero unusual activity instances.
The Lumous Settings We Used
We used Lumous 4.1.0 in Basic Mode, with the activity intensity set to Medium. Mouse movement, clicks, scrolling, tab switching, app switching, keyboard activity, and micro-breaks were all enabled.
| Setting | What we used |
|---|---|
| Safe Click Zones | Two zones, one on each side of the screen, to control where clicks can land. |
| Scrolling | Vertical and horizontal. |
| Tab switching | Browsers only, so tab-switching shortcuts stay within supported browsers. |
| App switching | Enabled; Lumous rotates through open applications that are not minimized. |
| Keyboard activity | Silent Keys. |
| Micro-breaks | 1–3 breaks per hour, lasting 30–120 seconds each. |
Basic Mode applies one intensity level across the features. Advanced Mode lets you adjust them individually. We kept Medium for the recording, with Word, Excel, Visual Studio Code, and Chrome open on the desktop.
How We Recorded and Reviewed the Time
We used a regular employee account to track the time and a separate admin account to review the results. The employee account is called Test User in the screenshots; the admin account is called Lumous Test. This lets us check the activity and alerts from the admin side, including anything the employee might not see.
We started at around 2 AM on October 6 and left Lumous running into the morning. Hubstaff recorded 9 hours and 15 minutes of worked time, 52% average activity, and zero unusual activity instances.
The Applications and Websites Hubstaff Recorded
In Hubstaff’s application report, we can see Google Chrome, Microsoft Excel, Visual Studio Code, and Microsoft Word—the same apps Lumous switches between in the recording. The hourly breakdown shows how much time Hubstaff recorded in each app, with different amounts throughout the morning as Lumous moves between them.
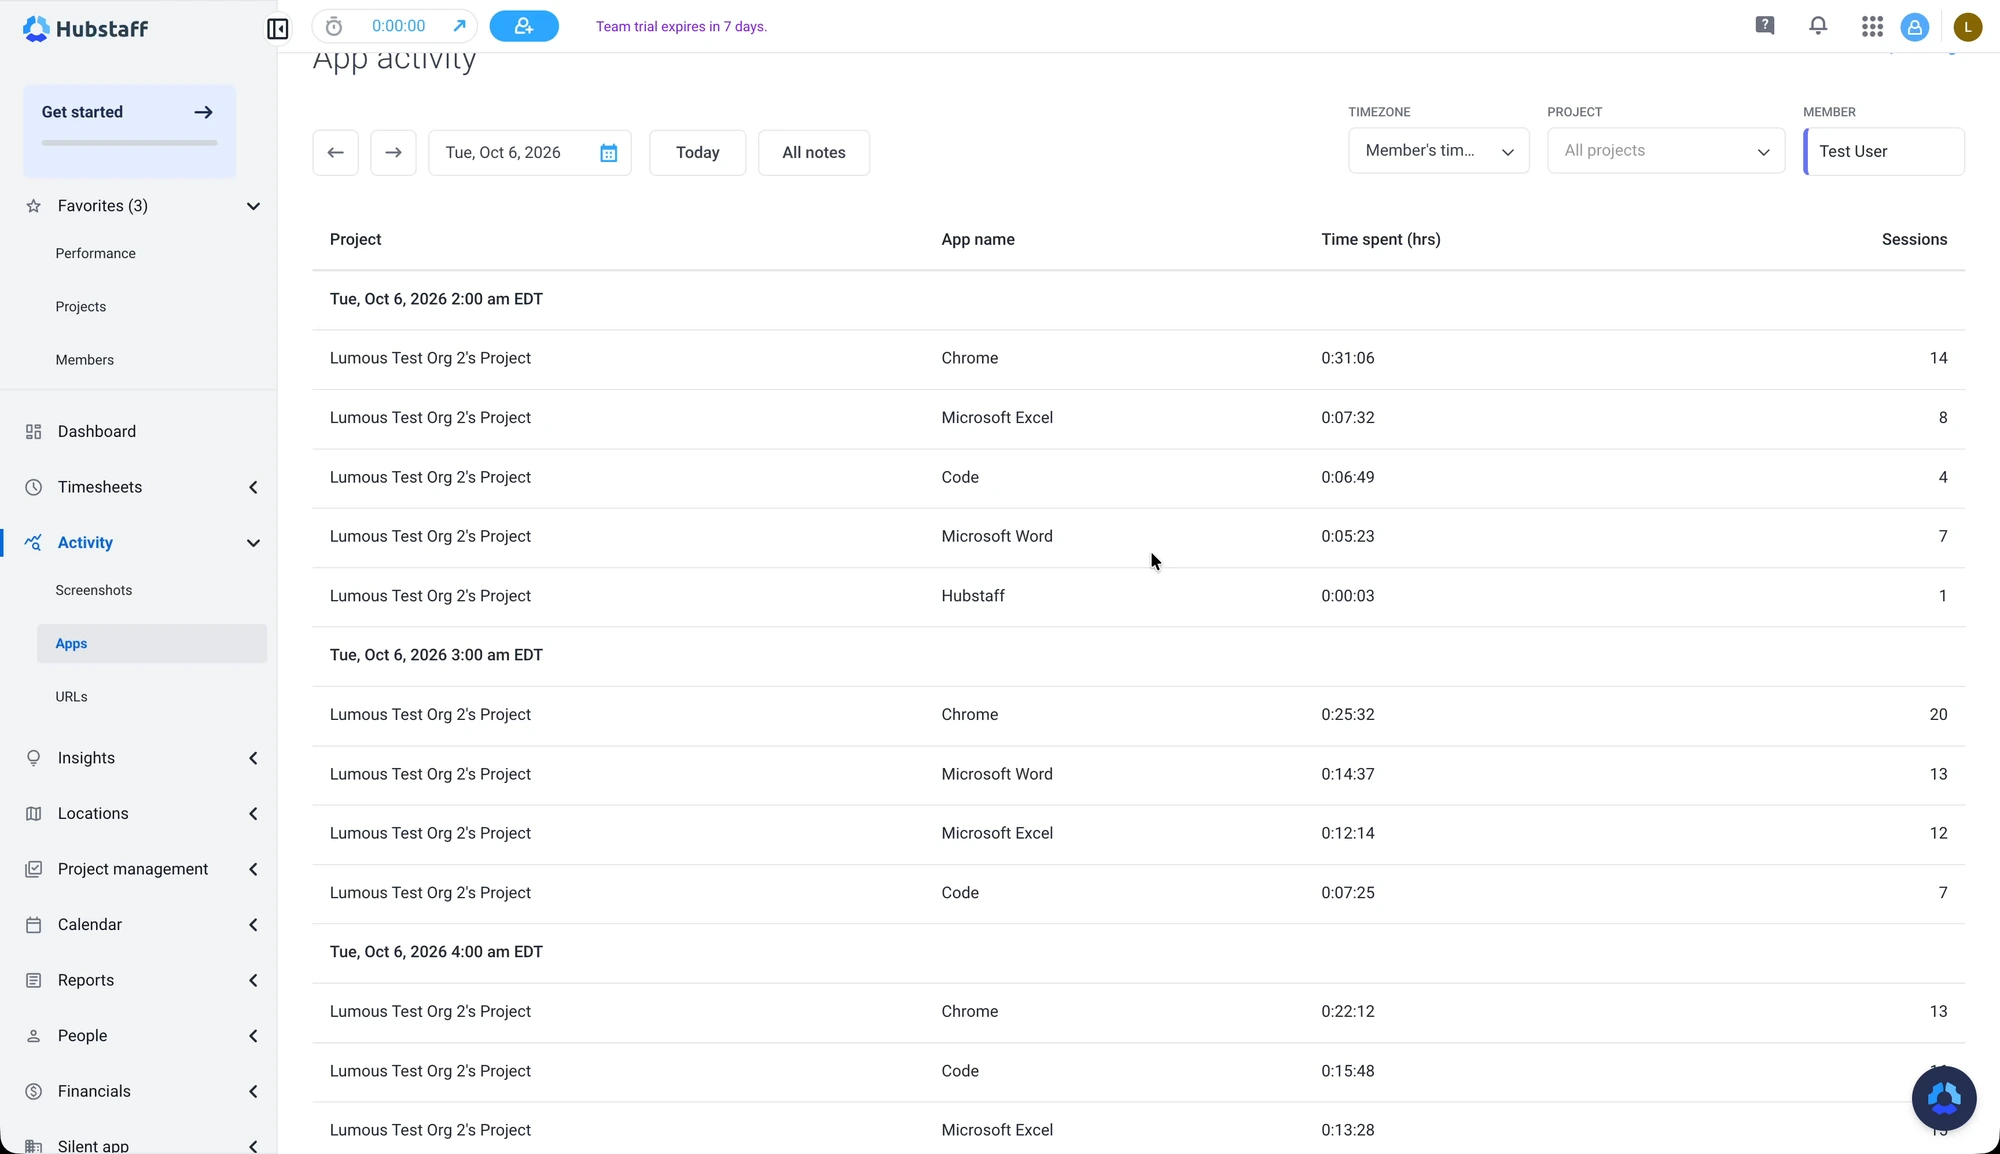
Hubstaff’s own app also appears where we started and stopped the timer. OBS Studio appears near the end because we opened it to stop the screen recording.
The URL report follows the same pattern. It includes BBC, Wikipedia, Google Drive, Google Docs, Wikivoyage, Google Calendar, Gemini, Stack Overflow, and Lumous (our website). These are the tabs we left open in Chrome for Lumous to switch between. You can follow those same pages in the timelapse and compare them with what Hubstaff recorded.
We left our website open as one of those Chrome tabs. Lumous switched to it along with the other pages, so Hubstaff recorded the visit. The Lumous desktop app runs under the name Reminders and would appear separately in the application report if opened while Hubstaff is tracking.
Screenshots, Mouse Activity, and Keyboard Activity
That 52% is the average across the recording. As we go through Hubstaff’s ten-minute intervals, the activity rises and falls. The mouse and keyboard numbers change too: some intervals have more mouse activity, while others have more keyboard activity. This is the variation we see while Lumous is running.
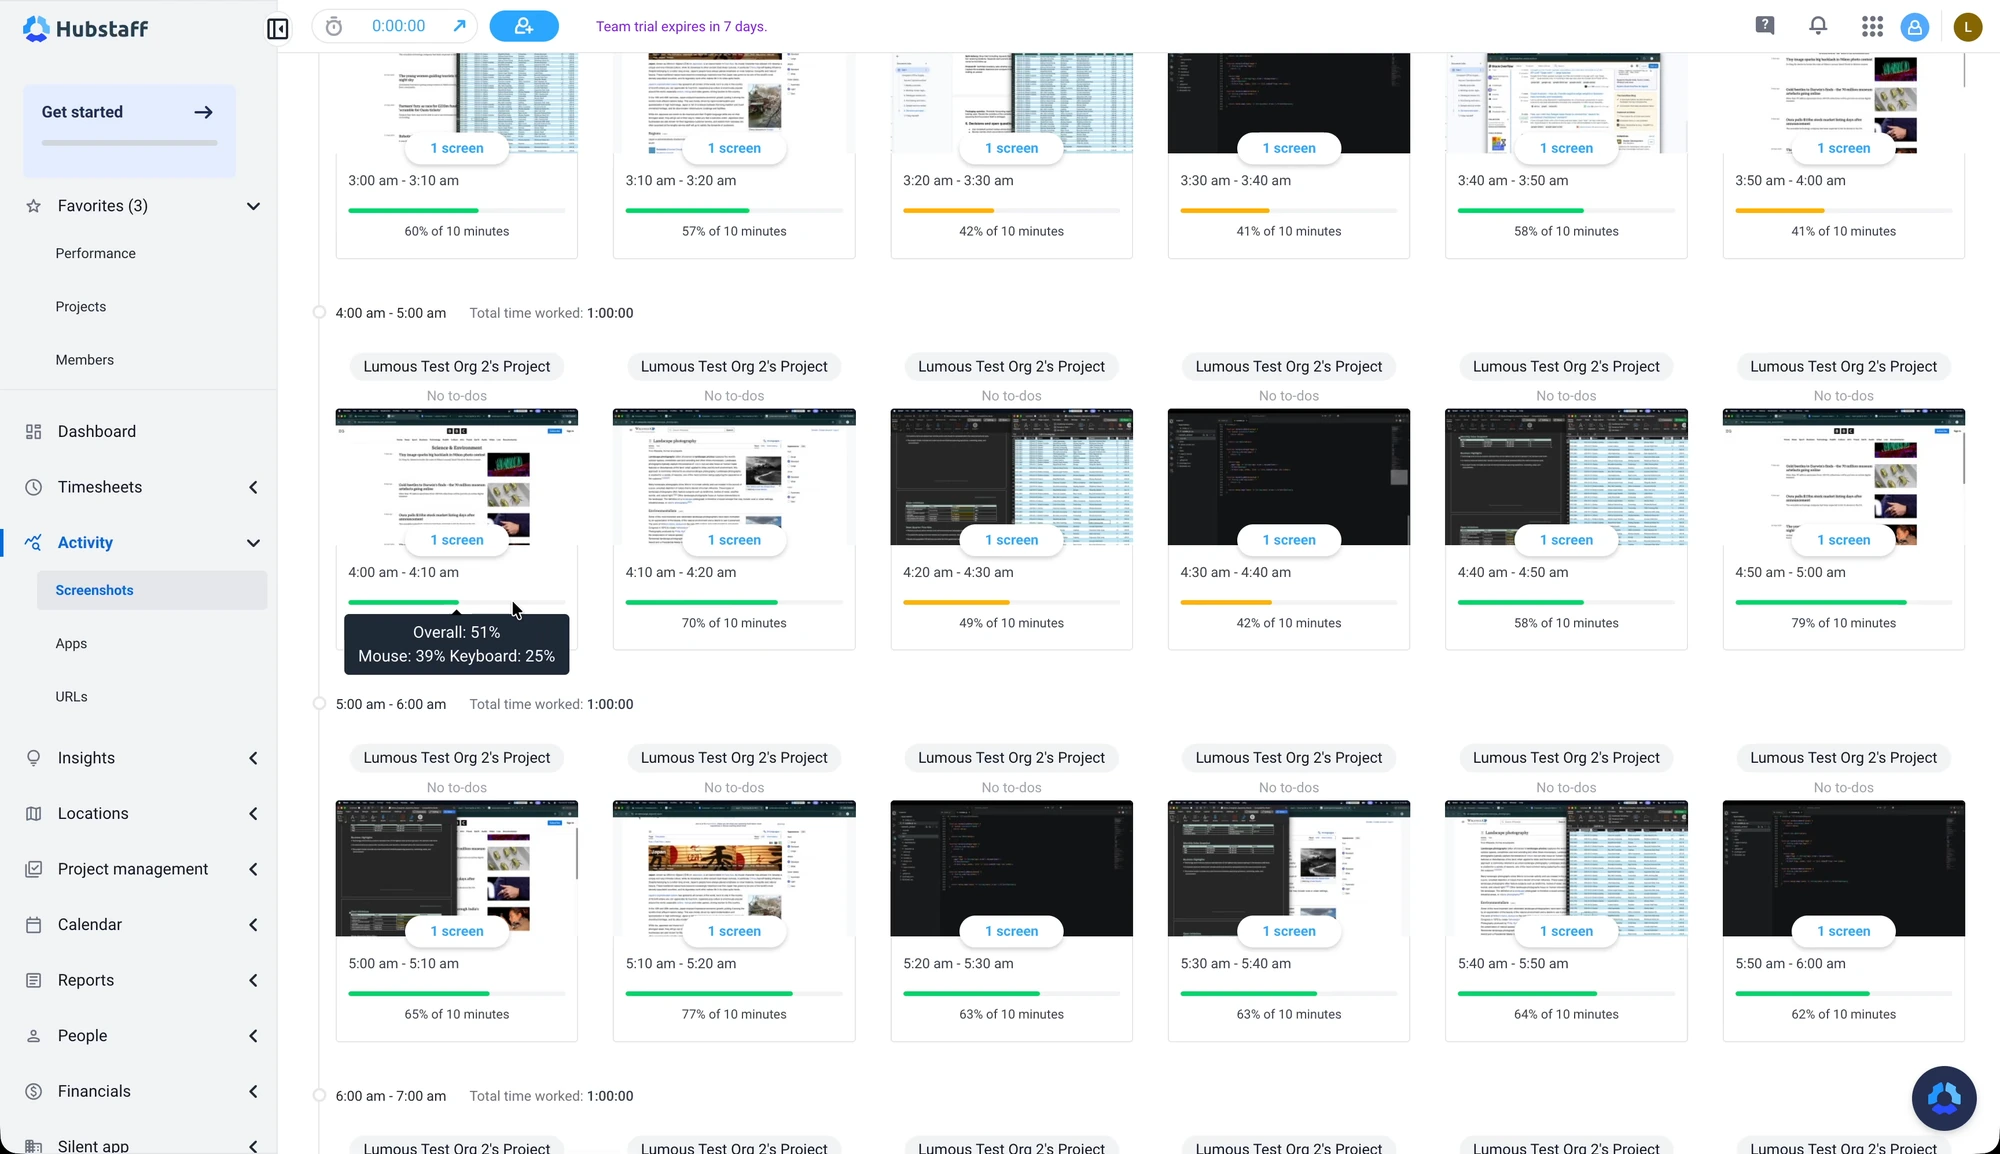
In the hour shown above, the activity ranges from 42% to 79%. Mouse and keyboard percentages can overlap because both types of input can occur in the same second; they do not need to add up to the overall figure. Hubstaff explains that calculation here.
You can also see the effect of Lumous switching apps and tabs in the screenshots. One capture might show a Word document, while another shows Excel or a browser page. When the same app appears again, Lumous may have scrolled to a different part of the content. The time on each capture lets you find the corresponding moment in the timelapse.
Hubstaff also classifies the apps and websites: 62% core work, 23% non-core work, and 15% unproductive. Those categories depend on which apps and tabs you leave open for Lumous to switch between and how your organization classifies them.
The dashboard also shows 0% focus time. Hubstaff counts focus time in uninterrupted stretches of at least 30 minutes on one project or task. Spending longer periods in apps it classifies as productive can help more time qualify, while extended visits to unproductive apps can interrupt a focus period. The apps and tabs you leave open, and how long Lumous spends in them, can therefore affect this figure. It is separate from the mouse-and-keyboard activity percentage.
Zero Unusual Activity Instances
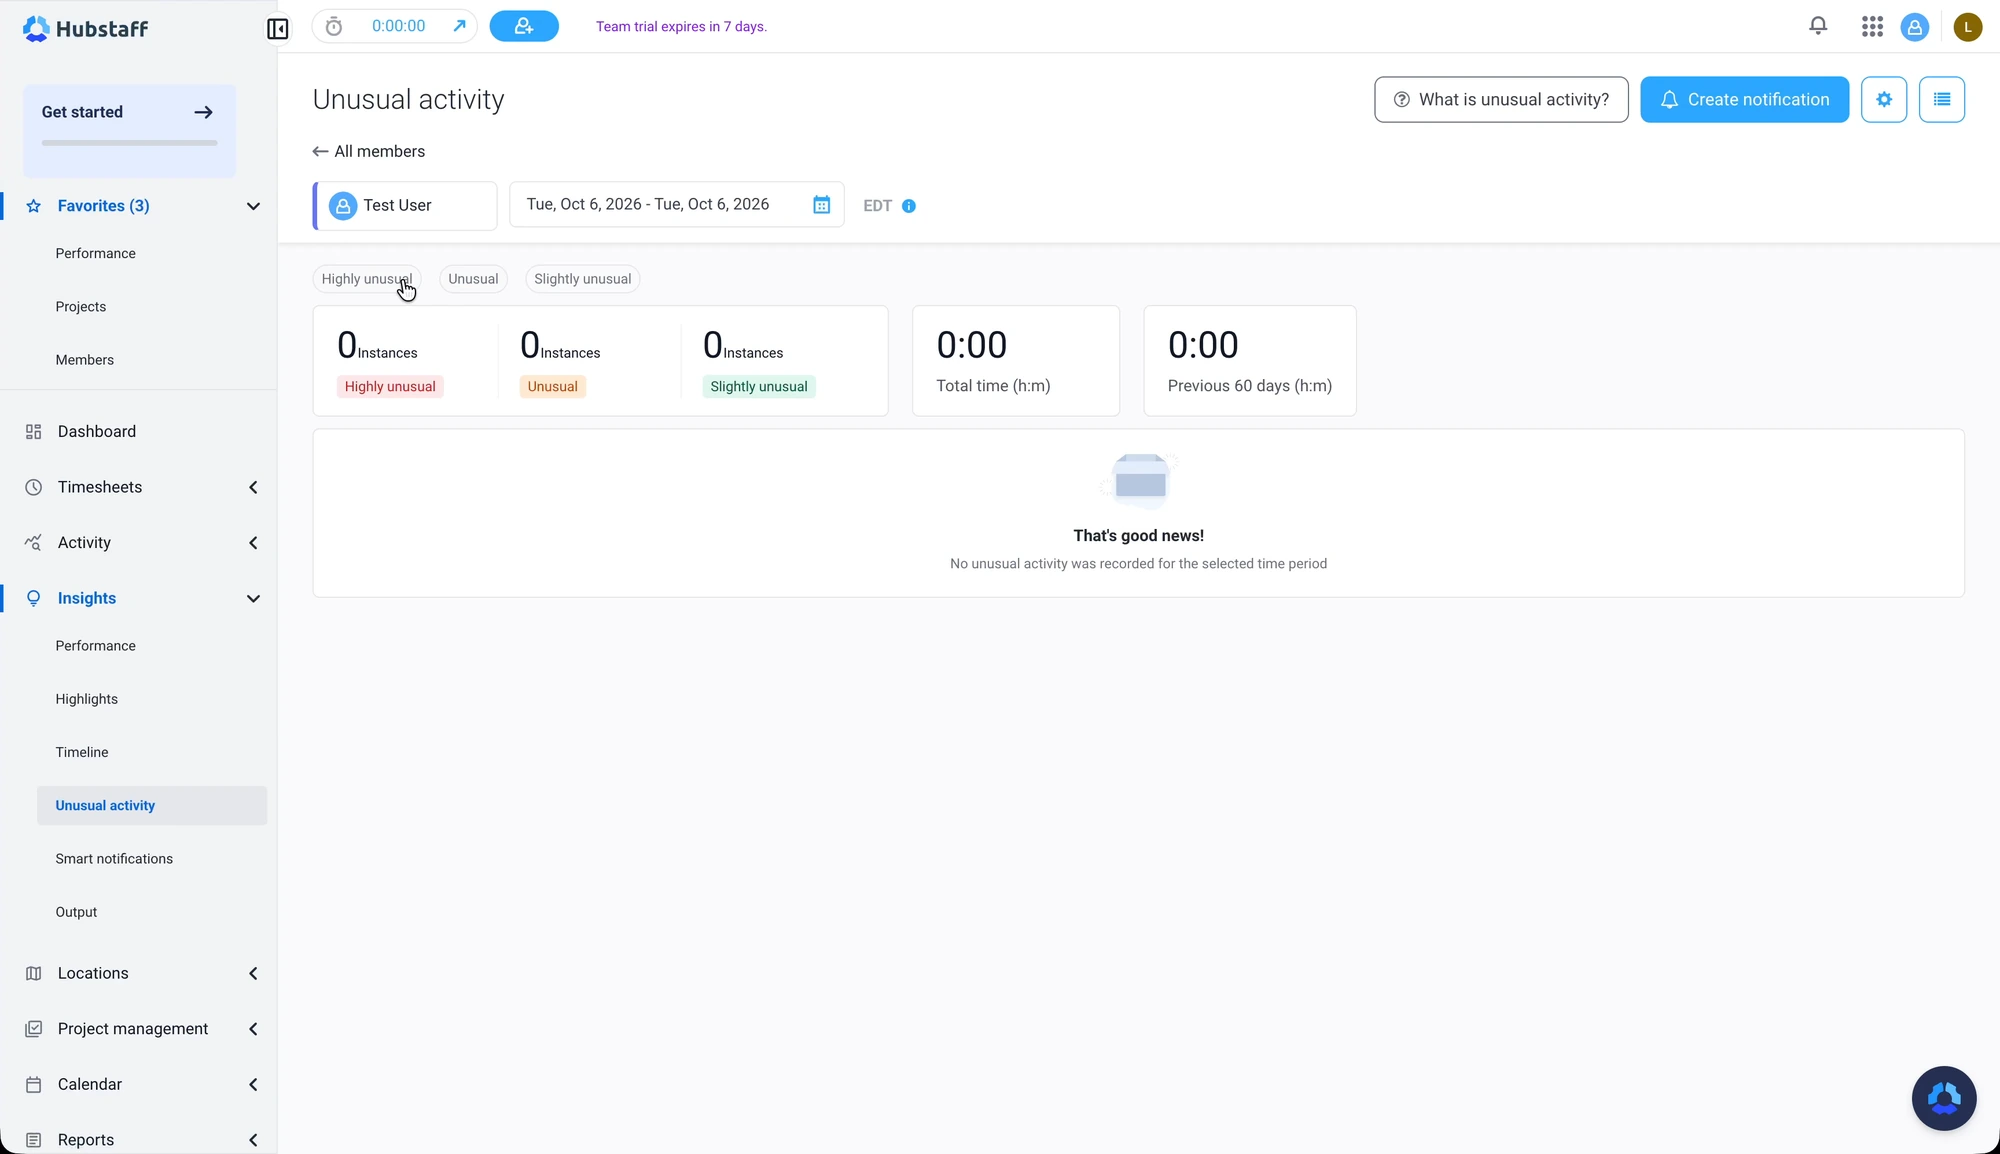
After checking the screenshots and input activity, we opened Hubstaff’s separate Unusual Activity report for the same employee. Hubstaff recorded zero highly unusual, zero unusual, and zero slightly unusual activity instances. We checked the individual category filters as well, and none returned a flagged entry.
The Result
Over 9 hours and 15 minutes, Hubstaff recorded changing app usage, varied screenshots, and a changing mix of mouse and keyboard activity. The overall activity average was 52%, with zero unusual activity instances.
You can also compare this with our earlier eight-hour Hubstaff test, or read the Hubstaff guide for more on its tracking features.
Watch the Recording
The video shows the Lumous settings and the admin dashboard, followed by the desktop recording sped up to about 20 minutes. The time and date in the top-right corner let you match the activity to Hubstaff’s screenshots and reports. The chapter links below take you to each part.
Video Chapters
- 0:43 — Lumous app and settings
- 3:27 — Hubstaff admin dashboard
- 4:15 — Applications and URL activity
- 6:35 — Screenshots, tracked time, and activity
- 7:25 — Mouse and keyboard activity by interval
- 9:39 — Unusual activity results
- 10:11 — Recorded session timelapse
Try Lumous with Hubstaff
The Lumous app overview explains the controls in more detail. For installation and permissions, follow the Windows or macOS setup guide.
Available for Windows and macOS. Every feature is included for $5/month. Contact us if you would like help with your setup.